When you were first starting to write JavaScript, you learned about console.log. You learned about outputting messages to the console and using it to troubleshoot your JavaScript. And unless you’re a fairly serious JavaScript developer, you might not have bothered with much more. When JavaScript apps don’t work correctly, developers are often quick to start peppering their code with console.log statements, echoing the values of expressions to the console to try and traceback an error. It’s hardly efficient, but for a simple program, it works. It probably won’t surprise you to learn that there is a better way to troubleshoot your JavaScript. Better still, there’s an awesome JavaScript debugger buried right inside your browser. You can use Firefox Quantum’s recently-revamped built-in JavaScript debugger or Google Chrome’s Sources tool to track and analyze your code and say goodbye to console.log for good.
In this post, we will be focusing on Firefox, but you can also find the same essential tools inside of Google Chrome’s DevTools. The overall layout off the debuggers is basically the same as well.
Getting Started with the JavaScript Debugger
To use the Firefox debugger, you’ll need to install Firefox. You can use the Developer Edition or the stable version, provided you have the newest version (codenamed Quantum). The Developer edition is sort of a half-way in-between Firefox Beta version, with some beta features geared specifically towards devs and a few UI tweaks. As far as we can tell, however, Firefox’s standard release channel contains all the same developer tools as Firefox Developer Edition.
We’ll be doing our debugging on a training site offered by Mozilla. Navigate to the site.

Open the Debugger by pressing Option + Command + S on a Mac or Control + Shift + S on a PC. This will slide up a pane from the bottom of Firefox’s primary window. If you’ve ever used Inspect Element before, this will be fairly familiar.

If you primarily use Chrome, you can also follow along in Chrome’s JavaScript debugger. It’s essentially the same, but it does have some cosmetic differences. Press Option + Command + I or Control + Shift + I to launch the Console in DevTools, then click on the “Sources” tab.
Once we have correct panel open in Firefox, we’ll want to click on the correct source. Navigate through the tree on the right until you’ve reached the JavaScript file you want to inspect. For your own projects, you’ll know what you’re looking at. For this project,
Using the JavaScript Debugger
If you’re not familiar with the idea behind using a debugger, you’re basically going through your code slowly and carefully inspecting the values of given expressions. This works the same whether it’s a C debugger or a JavaScript debugger.
Setting Breakpoints
In order to step through your code effectively, you need to set breakpoints. Breakpoints tell the debugger where to pause executing code for a moment, giving you the chance to inspect values.
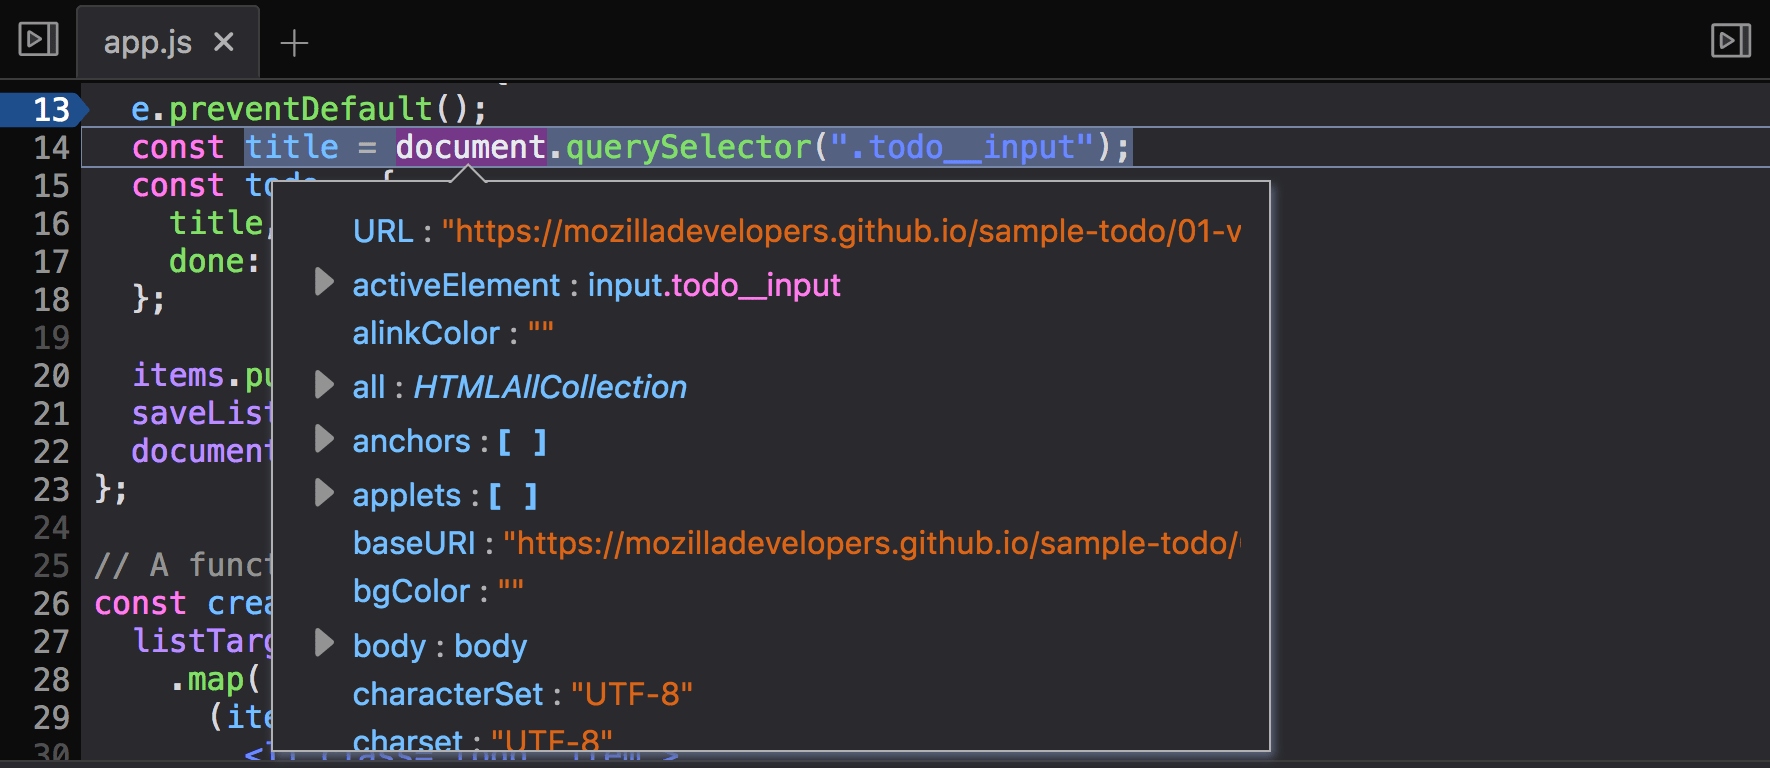
Click on a line value to set a breakpoint. Here, we’ll set a breakpoint at line 13 by clicking on its line number.
Once we’ve set our desired breakpoints, try adding an item to our to do list.

The code will “break” at that point, pausing its execution until we manually continue through the stack. This let’s us take our time inspecting values.
Inspecting Values
To inspect the value of a given expressing in our JavaScript, we can hover over the value to see all it’s parameters. This value will be updated as we progress through our code.
You can also see what’s going on in the Scopes pane on the right. The top Block shows the variable assignments current in scope for the current line.

Stepping through Code
Once we’ve set some breakpoints, we’ll want to control how we move through our code. This is called “stepping” through the code, and we can do it in various ways. There’s a few tools that will help us do that. These tools are available at the top of the right-side pane.

We can take a closer look at what they do.
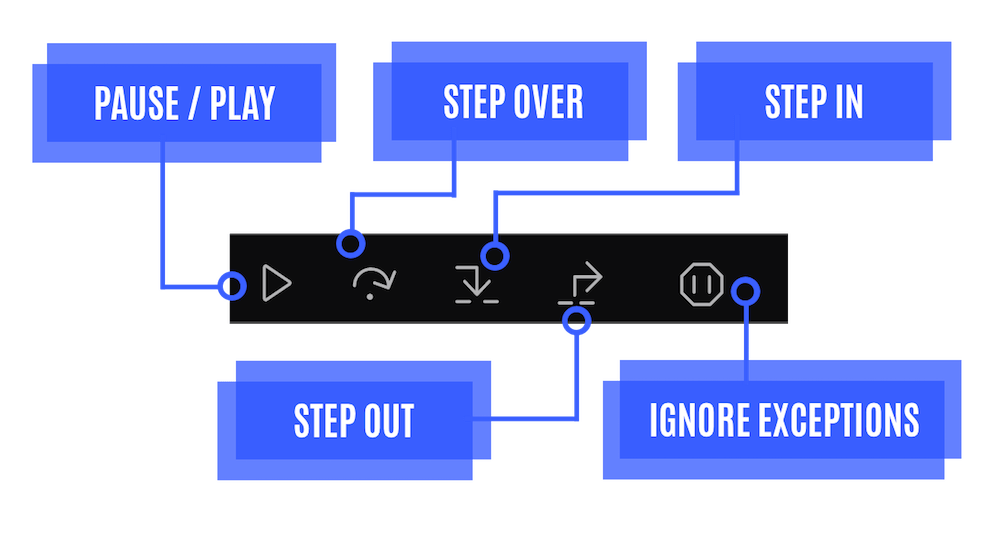
All of these tools run code one line at a time, but they behave different when they encounter functions.
Step Over: “step across” the current line. This will run the next line, executing any functions you encounter. This can automatically skip over many lines of code executing called functions.
Step In: run the code one line at a time, but navigate “inside” of any function you encounter. This allows you to quickly navigate to the contents of called functions for troubleshooting.
Step Out: exit a function that you entered with “Step In” and return to the main body of code.
Learning More
The JavaScript debugger is capable of more than the functions we’ve discussed here. You can learn more at Mozilla’s Debugger PlayGround, or dig in to their debugger documentation.
You might also be interested in the following posts:
How to Build a Firefox Extension
Best JavaScript Libraries for Building Web Interfaces
Learn Web Development With These Web Developer Courses
The post The Powerful JavaScript Debugger You Never Knew You Had appeared first on SpyreStudios.
from SpyreStudios http://spyrestudios.com/powerful-javascript-debugger-never-knew/
No comments:
Post a Comment